
I really love the data collected by Google Timeline, and I have fun going through it. But some of the most obvious data aggregates are not available! You cannot get how many miles you’ve biked this year, or how many hours you spent at your office, or how many hours you’ve spent walking, etc. You can see those stats on a day-per-day basis, which I’ll admit is interesting, but I usually already have an instinctual idea of I’ve done on a day-by-day basis. I’d like to imagine that I’d be totally surprised by what my stats would be for a full year.
So I downloaded my raw data from Google Takeout to try and play with, and it turns out to be one humongous geoJSON file. But it seems that it is laid out in the format of each unique timestamp taken, with all the associated data for that point. In most cases, you just get timestamp, latitude/longitude (E7), and accuracy.
{
 "timestampMs" : "1463961031129",
 "latitudeE7" : 377567650,
 "longitudeE7" : -1224178356,
 "accuracy" : 20
 }
But sometimes there’s a list of “activities,” with Google’s “confidence” that the activity listed was the one… being done. They seem to always add up to 100%, if you assume that “on foot” is the same as “walking,” but it isn’t clear to me why both get listed in those cases
{
 "timestampMs" : "1463951764885",
 "latitudeE7" : 377617843,
 "longitudeE7" : -1224204018,
 "accuracy" : 20,
 "activitys" : [ {
 "timestampMs" : "1463951764173",
 "activities" : [ {
 "type" : "onFoot",
 "confidence" : 92
 }, {
 "type" : "walking",
 "confidence" : 92
 }, {
 "type" : "onBicycle",
 "confidence" : 8
 } ]
 } ]
 }
This much is pretty obvious. But then you get activities like “tilting” and other weird things.
Sometimes you get an associated velocity, altitude, and heading. But not usually. Note: I haven’t figured out yet whether the velocity is in kmph or mph.
{
 "timestampMs" : "1463268526270",
 "latitudeE7" : 380429730,
 "longitudeE7" : -1227851373,
 "accuracy" : 10,
 "velocity" : 20,
 "heading" : 239,
 "altitude" : 21,
 "activitys" : [ {
 "timestampMs" : "1463268515541",
 "activities" : [ {
 "type" : "inVehicle",
 "confidence" : 100
 }, {
 "type" : "still",
 "confidence" : 8
 } ],
 "extras" : [ {
 "type" : "value",
 "name" : "vehicle_personal_confidence",
 "intVal" : 100
 } ]
 } ]
 }
So, obviously I’d have to do some calculations based on the latitude and longitude to get data on distances. Which I haven’t done. So I guess I’ll probably just consider the timestamps that have types associated, and for simplicity’s sake I’ll most likely end up only considering the one with the highest “confidence.” With that method, it would be pretty easy to calculate total times. Distances… not as easy, mostly because I haven’t worked with latitudes and longitudes very much. But I’m sure there’s some module out there or something for handling that, so I probably won’t have to learn too much about it 😉
All I’ve done with my data thus far was convert all the timepoints with associated lat/long into human dates with lat/long that are not… E7. So now I have 1,048,575 lines formatted like this
2016-05-22 T14:58:35-07:00 37.7570186, -122.4204018
All the way back to
2013-09-20 T08:18:54-07:00 37.7650828, -122.4172515
Which is the first timepoint I have in my Google Location History.
This format makes it super easy for me to quickly generate maps like
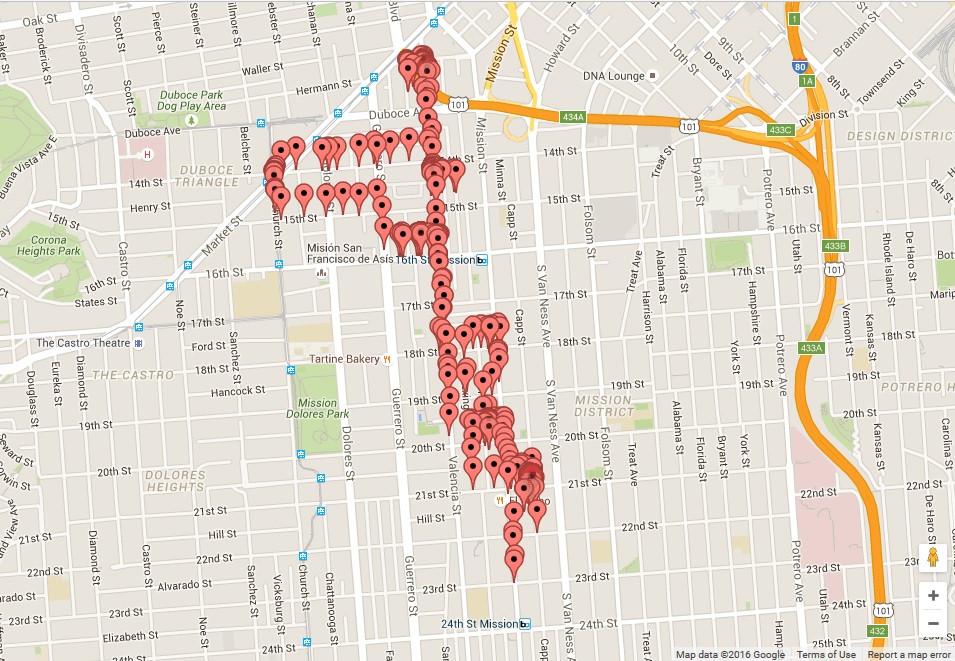
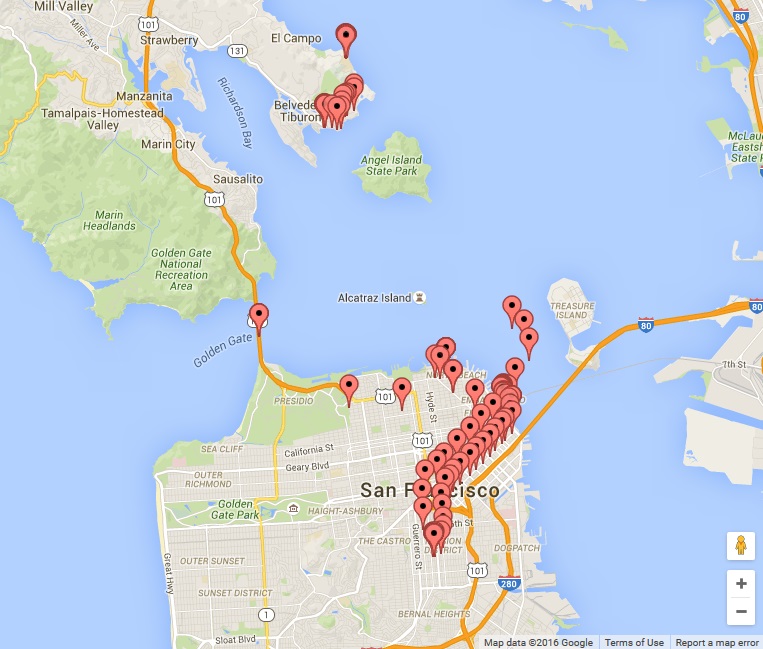
Or even overlays of multiple days, etc. Which, I realize, is… baaaasically exactly what I can already get from Google Location History through my Timeline.
But! My next step is to calculate how many hours per year were spent doing each activity (walking/biking/driving/etc). There will obviously be far fewer than 1,048,575 timepoints for which there is activity data associated, because most timepoints don’t have any activity.
I haven’t started thinking about the mileage counter yet, so if anybody has any suggestions for handling latitude/longitude points and calculating mileage from those, I guess feel free to let me know. Otherwise, I’ll just let you all know what stats I come up with.
Update 6/5/2016:
My ongoing saga of Google Location History data continues here…